traffic_top
Description
The traffic_top program provides a simple CLI view of your Traffic Server statistics, reminiscent of programs like top(1) and nmon(1) for system processes and statistics.
Options
-
-sCOUNT¶ Number of seconds in between each polling of the Traffic Server statistics API. The default is 5 seconds.
-
URL|hostname|hostname:port¶ Location at which the JSON output of Traffic Server statistics are accessible.
Requirements
The traffic_top program requires that your Traffic Server nodes are running the Stats Over HTTP plugin and that the machine from which you run traffic_top is able to access the HTTP(S) end point for the plugin.
If, for example, you have the following entry in your plugin.config to
enable the plugin:
stats_over_http.so statistics
And your Traffic Server node is accessible using the hostname ats.example.tld
(listening on port 80), then you would run traffic_top as follows:
traffic_top http://ats.example.tld/statistics
The hostname, port, and path to the Stats Over HTTP plugin JSON output should be adjusted as necessary to match your environment.
Important
The statistics provided by Traffic Server (through traffic_ctl and Stats Over HTTP Plugin) expose quite a bit about the inner workings of your Traffic Server cache. While consumers of the JSON statistics endpoint won’t be able to see or modify the raw contents of your cache, it is still very strongly advised to limit access to this URL.
Interface
Upon startup (and successful connection to the Stats Over HTTP Plugin endpoint), you will be presented with a curses interface that looks like:
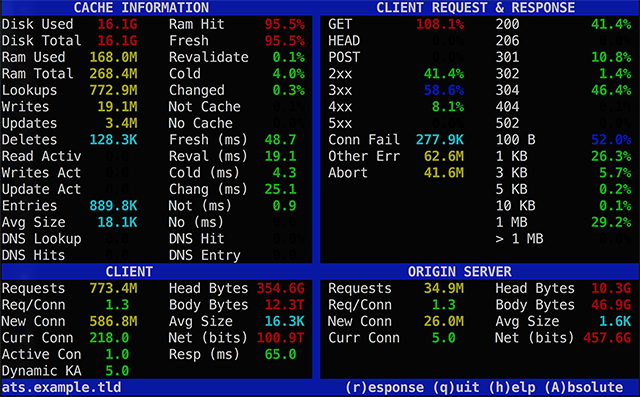
Main interface for the traffic_top command line program.
Each area of the main interface is explained in the following sections.
Cache Information
Disk Used
The amount of disk space currently in use by the Traffic Server cache. This number will never exceed Disk Total.
Statistic: proxy.process.cache.bytes_used.
Disk Total
Total disk space allocated for Traffic Server cache.
Statistic: proxy.process.cache.bytes_total.
Ram Used
Current amount of RAM Cache occupied by objects. Objects located and served from the Traffic Server RAM Cache avoid the much slower disk I/O necessary to serve from spinning rust.
Statistic: proxy.process.cache.ram_cache.bytes_used
Ram Total
Total space allocated for used by the Traffic Server RAM Cache.
Statistic: proxy.process.cache.ram_cache.total_bytes
Lookups
Total cache object lookups performed, including disk and RAM caches.
Statistic: proxy.process.http.cache_lookups
Writes
Total number of object writes to the Traffic Server cache.
Statistic: proxy.process.http.cache_writes.
Updates
Total number of existing cache objects which have been updated with new content from the origin server (i.e. existing cache object was stale, so Traffic Server revalidated against the origin and received a new object).
Statistic: proxy.process.http.cache_updates.
Deletes
Total number of Traffic Server cache objects which have been deleted (generally through a PURGE request).
Statistic: proxy.process.http.cache_deletes.
Entries
The current number of cache directory entries in use.
Statistic: proxy.process.cache.direntries.used.
Avg Size
The average size of current in the cache directory. This is calculated by dividing Entries into Disk Used.
Statistics: proxy.process.cache.bytes_used,
proxy.process.cache.direntries.used.
DNS Lookup
Total number of DNS lookups performed by Traffic Server, regardless of whether they were full DNS queries or were satisfied by entries in the HostDB cache. If you are not operating a forward proxy and if none of your origin servers are mapped by hostnames, then it is normal for your HostDB cache to be empty.
Statistic: proxy.process.hostdb.total_lookups.
DNS Hits
Total number of DNS lookups which were successfully served from the HostDB cache.
Statistic: proxy.process.hostdb.total_hits.
Ram Hit
The percentage of cache lookups which were served successfully from the RAM Cache (thus avoiding slower I/O from the disk cache, or even slower network I/O to the origin server). This is calculated as a ratio from the two RAM Cache statistics for hits and misses.
Statistics: proxy.process.cache.ram_cache.hits,
proxy.process.cache.ram_cache.misses.
Fresh
The percentage of cache lookups which located a fresh cache object (i.e. an object not in need of any revalidation). These transactions are served directly from the cache to the client without any need to contact origin servers or spend time updating the cache. An effective Traffic Server cache will have a very high Fresh percentage, as these are the fastest responses to clients.
Statistic: proxy.process.http.transaction_counts.hit_fresh.
Revalidate
The percentage of cache lookups which located a stale cache object, but for which the origin server did not return new data when Traffic Server revalidated the object. Revalidated objects don’t incur cache update performance hits, but they do still lead to (what ends up being unnecessary) network traffic with origin servers.
A high percentage of revalidated cache lookups may indicate that Traffic Server is being too aggressive with its object staleness heuristics.
Statistic: proxy.process.http.transaction_counts.hit_revalidated.
Cold
The percentage of cache lookups which located an expired cache object. These were requests which located a matching object in the cache, but it had already been expired fully and a new copy was retrieved from the origin server. Unfortunately, the new copy from the origin server ended up being the unchanged from what had been marked expired in the cache.
A high percentage of cold misses indicates that your origin servers are setting expirations on their responses which are too short, as compared to the actual lifetime of the content in those responses.
Statistic: proxy.process.http.transaction_counts.miss_cold.
Changed
The percentage of cache lookups which located an expired cache object and which resulted in new data being retrieved from the origin server.
Statistic: proxy.process.http.transaction_counts.miss_changed.
Not Cache
The percentage of requests for which the requested object was marked not cacheable by the origin server. A high percentage of uncacheable objects may indicate that either your origin servers simply contain a large amount of dynamic, uncacheable data, or that they are not properly setting cache control headers in their responses.
Statistic: proxy.process.http.transaction_counts.miss_not_cacheable.
No Cache
The percentage of requests for which the client indicated that the cache should
not be used (e.g. a Cache-Control: no-cache request header was present).
A high percentage of these requests may indicate possible client-side abuse of your proxy, in which a disproportionate number of client connections are attempting to force their way past your Traffic Server cache.
Statistic: proxy.process.http.transaction_counts.miss_client_no_cache.
Fresh (ms)
The average amount of time per lookup (in milliseconds) spent serving requests which were served by fresh cache lookups. Note that the underlying statistic is the total amount of time Traffic Server has spent serving these requests since startup, whereas traffic_top is displaying the number averaged by the total Fresh requests.
Statistic: proxy.process.http.transaction_totaltime.hit_fresh.
Reval (ms)
The average amount of time per lookup (in milliseconds) spent serving requests which involved revalidating a stale object for which the origin server did not return new data. Note that the underlying statistic is the total amount of time Traffic Server has spent serving these requests since startup, whereas traffic_top is displaying the number averaged by the total Revalidate requests.
Statistic: proxy.process.http.transaction_totaltime.hit_revalidated.
Cold (ms)
The average amount of time per lookup (in milliseconds) spent serving requests which involved expired cache objects. Note that the underlying statistic is the total amount of time Traffic Server has spent serving these requests since startup, whereas traffic_top is displaying the number averaged by the total Cold requests.
Statistic: proxy.process.http.transaction_totaltime.miss_cold.
Chang (ms)
The average amount of time per lookup (in milliseconds) spent serving requests which were served by Traffic Server with new data obtained from an origin server. Note that the underlying statistic is the total amount of time Traffic Server has spent serving these requests since startup, whereas traffic_top is displaying the number averaged by the total Changed requests.
Statistic: proxy.process.http.transaction_totaltime.miss_changed.
Not (ms)
The average amount of time per lookup (in milliseconds) spent serving requests which were served from the origin server because it had marked the object as uncacheable. Note that the underlying statistic is the total amount of time Traffic Server has spent serving these requests since startup, whereas traffic_top is displaying the number averaged by the total Not Cache requests.
Statistic: proxy.process.http.transaction_totaltime.miss_not_cacheable.
No (ms)
The average amount of time per lookup (in milliseconds) spent serving requests which were served by the origin server because the client had requested that the Traffic Server cache be bypassed. Note that the underlying statistic is the total amount of time Traffic Server has spent serving these requests since startup, whereas traffic_top is displaying the number averaged by the total No Cache requests.
Statistic: proxy.process.http.transaction_totaltime.miss_client_no_cache.
DNS Hit
The percentage of DNS lookups which were served from the HostDB cache, rather than requiring full DNS queries.
Statistics: proxy.process.hostdb.total_hits,
proxy.process.hostdb.total_lookups.
DNS Entry
The total number of entries in the HostDB lookup cache. If you are not operating a forward proxy and if none of your origin servers are mapped by hostnames, then it is normal for your HostDB cache to be empty.
Statistic: proxy.process.hostdb.cache.current_items.
Client Request & Response
GET, HEAD, POST
Each of these display the percentage of total requests by clients to Traffic Server which used the given HTTP method.
Statistics: proxy.process.http.get_requests,
proxy.process.http.head_requests,
proxy.process.http.post_requests.
2xx
Percentage of all requests made to Traffic Server which resulted in an HTTP response code between 200 and 299 (inclusive) being sent back to the client. 2xx response codes all indicate some form of successful transaction with content delivered.
Statistic: proxy.process.http.2xx_responses.
3xx
Percentage of all requests made to Traffic Server which resulted in an HTTP response code between 300 and 399 (inclusive) being sent back to the client. 3xx response codes indicate non-error conditions; most commonly redirects or IMS not-modified responses that did not deliver content (because they did not need to).
Statistic: proxy.process.http.3xx_responses.
4xx
Percentage of all requests made to Traffic Server which resulted in an HTTP response code between 400 and 499 (inclusive) being sent back to the client. 4xx response codes are used for requests which included a client-side error. Most frequently these responses are for invalid URLs (e.g. 404 Not Found), but also include authentication failures (e.g. 403 Forbidden). In short, Traffic Server refused to fulfill the request because the client sent invalid or incorrect information.
Statistic: proxy.process.http.4xx_responses.
5xx
Percentage of all requests made to Traffic Server which resulted in an HTTP response code between 500 and 599 (inclusive) being sent back to the client. 5xx response code indicate a server-side error. For a caching proxy like Traffic Server, these are likely to be most often returned for gateway errors; e.g. 502 Bad Gateway (the origin server address was invalid or a connection could not be established at all due to system or network failures) and 504 Gateway Timeout (the origin server was contacted, but did not return data in the time allowed).
Statistic: proxy.process.http.5xx_responses.
Conn Fail
The total number of connections to Traffic Server which failed to connect properly.
Statistic: proxy.process.http.transaction_counts.errors.connect_failed.
Other Err
The total number of Traffic Server transactions which experienced an error not covered by Conn Fail and Abort.
Statistic: proxy.process.http.transaction_counts.errors.other.
Abort
The total number of Traffic Server transactions which were prematurely ended (connection was closed before all data had been received and/or sent).
Statistic: proxy.process.http.transaction_counts.errors.aborts.
200, 206, 301, 302, 304, 404, 502
The percentage of total Traffic Server transactions which resulted in the specified HTTP response code. For details on the meaning of individual status codes, please refer to HTTP Status Codes.
Statistics:
proxy.process.http.200_responses,
proxy.process.http.206_responses,
proxy.process.http.301_responses,
proxy.process.http.302_responses,
proxy.process.http.304_responses,
proxy.process.http.404_responses,
proxy.process.http.502_responses.
Note
Traffic Server also provides statistics for every other response code. The keen observer will have hopefully already recognized the pattern in statistic names.
100 B, 1 KB, 3 KB, 5 KB, 10 KB, 1 MB, > 1 MB
Each of these fields indicates the percentage of responses from Traffic Server which fell
within a particular size (document body size, excluding response headers). The
individual fields are the upper bounds of exclusive buckets, meaning that a
response with a document body of 4,500 bytes will be counted in the 5 KB
field, but not in any of the smaller sizes.
Statistics:
proxy.process.http.response_document_size_100,
proxy.process.http.response_document_size_1K,
proxy.process.http.response_document_size_3K,
proxy.process.http.response_document_size_5K,
proxy.process.http.response_document_size_10K,
proxy.process.http.response_document_size_1M,
proxy.process.http.response_document_size_inf.
Client
Requests
Total number of client requests serviced by Traffic Server. This includes both successful content-bearing responses as well as errors, redirects, and not-modified IMS responses. Additionally, this number includes requests which were serviced from the Traffic Server cache as well as through proxied origin connections.
Statistic: proxy.process.http.incoming_requests.
Req/Conn
The average number of requests made per client connection. When Keep-Alive support is enabled in Traffic Server and clients make use of it, they are able to submit multiple document requests over a single connection in some situations. This number is calculated from the total number of client requests divided by the total number of new connections that have been created.
Statistics:
proxy.process.http.incoming_requests,
proxy.process.http.total_client_connections.
New Conn
The total number of new HTTP connections from clients which have been created over the lifetime of the Traffic Server process.
Statistic: proxy.process.http.total_client_connections.
Curr Conn
The number of currently-open HTTP connections from clients with Traffic Server.
Statistic: proxy.process.http.current_client_connections.
Active Con
The number of currently active client connection threads (requests in the process of being fulfilled when the statistics snapshot was taken).
Statistic: proxy.process.http.current_active_client_connections.
Dynamic KA
Statistics:
proxy.process.net.dynamic_keep_alive_timeout_in_total,
proxy.process.net.dynamic_keep_alive_timeout_in_count.
Head Bytes
The total bytes consumed by outgoing server response headers from Traffic Server to clients.
Statistic: proxy.process.http.user_agent_response_header_total_size.
Body Bytes
The total bytes consumed by outgoing document bodies in responses from Traffic Server to clients.
Statistic: proxy.process.http.user_agent_response_document_total_size.
Avg Size
Average size in bytes of combined headers and document bodies for Traffic Server responses to clients.
Statistics:
proxy.process.http.user_agent_response_header_total_size,
proxy.process.http.user_agent_response_document_total_size,
proxy.process.http.incoming_requests.
Net (bits)
The summed bits (not bytes) of all Traffic Server responses to clients, whether served from the Traffic Server or through a proxied connection to an origin server.
Statistics:
proxy.process.http.user_agent_response_header_total_size,
proxy.process.http.user_agent_response_document_total_size.
Resp (ms)
The average response time by Traffic Server across all client requests. Response time is measured from the moment a client connection is established, until the moment the last byte of the response is delivered. This field is simply the result of dividing the total time spent by Traffic Server servicing client requests by the total number of those requests.
Statistics: proxy.process.http.total_transactions_time,
proxy.process.http.incoming_requests.
Origin Server
Requests
The total number of requests made by Traffic Server to origin servers, because client requests could not be fulfilled by the Traffic Server cache (for any reason, whether it was not present in the cache, was stale or expired, or not cacheable).
Statistic: proxy.process.http.outgoing_requests.
Req/Conn
The average number of requests made to origin servers by Traffic Server per connection. This field is simply the result of dividing the total number of requests made by the total number of connections that have ever been opened.
Statistics:
proxy.process.http.outgoing_requests,
proxy.process.http.total_server_connections.
New Conn
The total number of new HTTP connections from Traffic Server to origin servers that have been created during the lifetime of the Traffic Server process.
Statistic: proxy.process.http.total_server_connections.
Curr Conn
The number of HTTP connections currently open from Traffic Server to origin servers. Note that Traffic Server maintains a configurable number of origin server connections open at all times, whether there are requests being proxied or not, when configured as a reverse proxy to a known list of origin servers. This is not the case for forward proxy configurations, however, as Traffic Server has no foreknowledge of the servers to which clients may try to connect.
Statistic: proxy.process.http.current_server_connections.
Head Bytes
The total bytes delivered as headers in responses from origin servers to Traffic Server.
Statistic: proxy.process.http.origin_server_response_header_total_size.
Body Bytes
The total bytes delivered as document bodies in responses from origin servers to Traffic Server.
Statistic: proxy.process.http.origin_server_response_document_total_size.
Avg Size
The average size of the combined header and document body responses from origin servers to Traffic Server.
Statistics:
proxy.process.http.origin_server_response_header_total_size,
proxy.process.http.origin_server_response_document_total_size,
proxy.process.http.outgoing_requests.
Net (bits)
The total bits (not bytes) transferred from origin servers to Traffic Server for proxied requests not fulfilled by the Traffic Server cache.
Statistics:
proxy.process.http.origin_server_response_header_total_size,
proxy.process.http.origin_server_response_document_total_size.